Why I Don't Vote
Wolfram Mathematica is an amazing software that I love using, but the choice to use it for any meaningful application is difficult to justify due to its cost and licence.
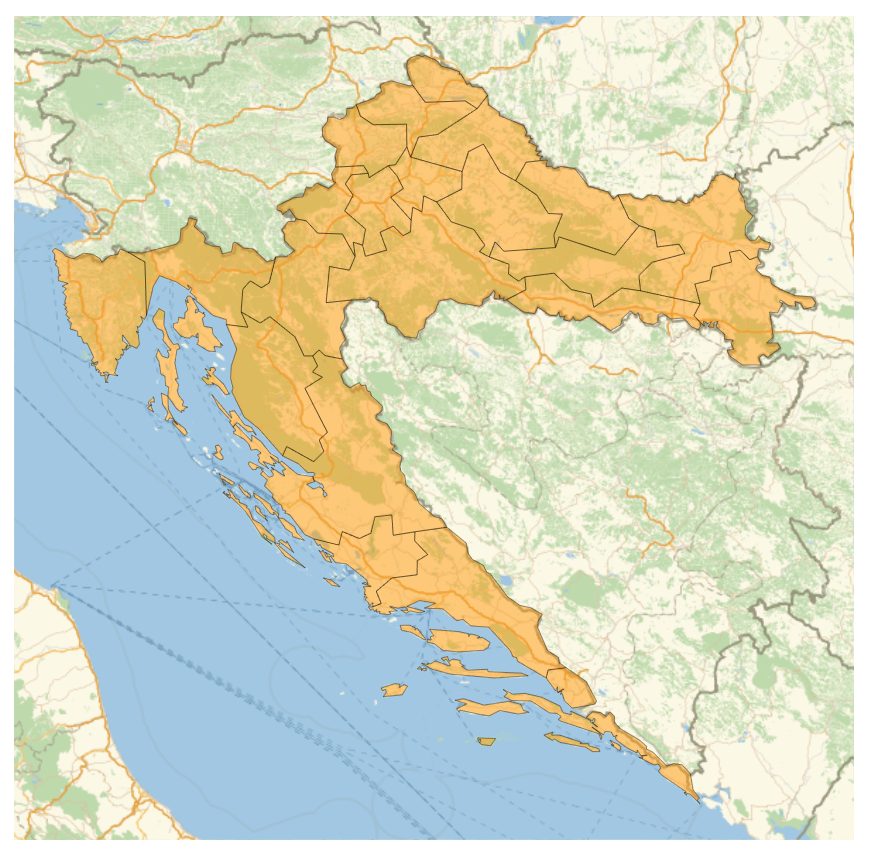
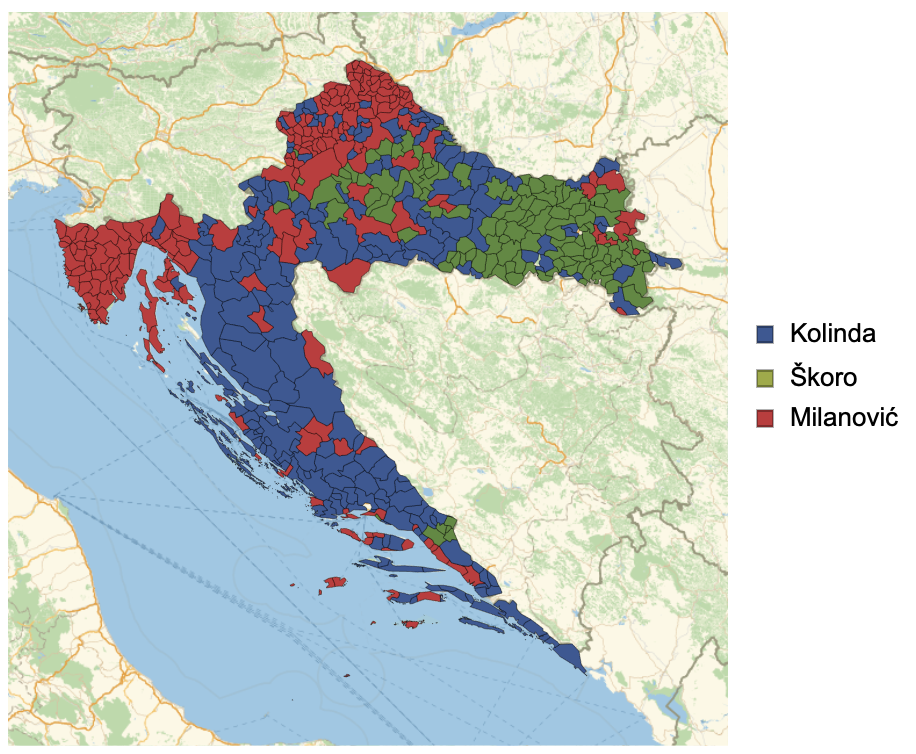
Presidential elections in Croatia seemed like a good excuse to fire it
up and generate some graphs. Which I did. And here is the winner of the election per administrative subdivisions: 
Mathematica 12 updated the built in database of geographic entities, so I was optimistic about using it to generate graphs showing results of the elections, broken down by Croatian administrative subdivisions (županije and općine).
First step was to map the subdivision names from the election results onto Mathematica entities. Election results are broken down by first administrative level (županije) and by second administrative level (općine). There is also a breakdown by country, for Croatian citizens living abroad.
- There is only 21 first level administrative units, so I just mapped those by hand.
- People voted in 48 different countries and I wanted to avoid mapping those by hand. Passing the Croatian names to the translate API first worked well. This mapped all of the countries bar a few where abbreviated name was used in the results (Croatian abbreviation for USA is SAD, which was translated to now) or where the country name changed recently (like Macedonia).
- There are 556 second level administrative units in Croatia. Luckily Mathematica doesn’t translate these name, so a simple removal of whitespace and replacement of special Croatian characters mapped around 540 of them out of the box.
The full mapping of Croatian names to Mathematica entities is available on GitHub
To use it you simply checkout the package, import entities with:
NotebookEvaluate["PATH_TO_CHECKOUT_REPO/MathematicaCroatianGeoEntities/\
croatian_admin_subdivisions.wl"]
You can then generate the graphs with:
GeoListPlot[Values[adminDivisions1]]
GeoListPlot[
 Flatten[Values[
   Join[adminDivisions2[#] & /@ Keys[adminDivisions2]]]]]
GeoListPlot[Values[adminDivisions2["KARLOVAČKA ŽUPANIJA"]],
 GeoBackground -> GeoStyling["StreetMap"]]
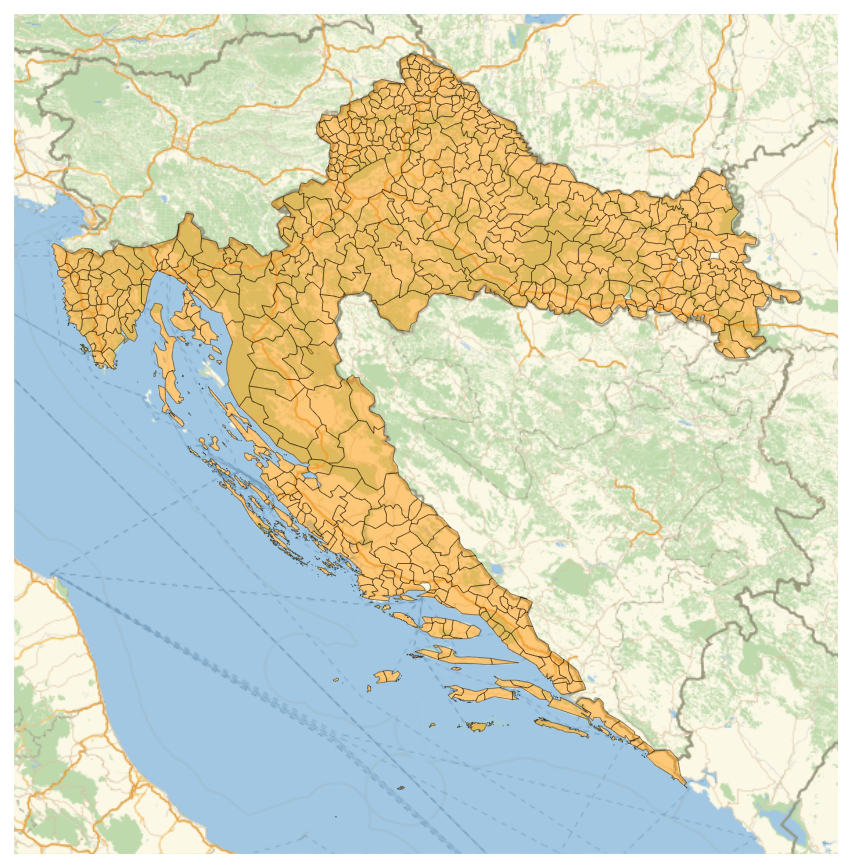
This will create maps with all subdivision borders:
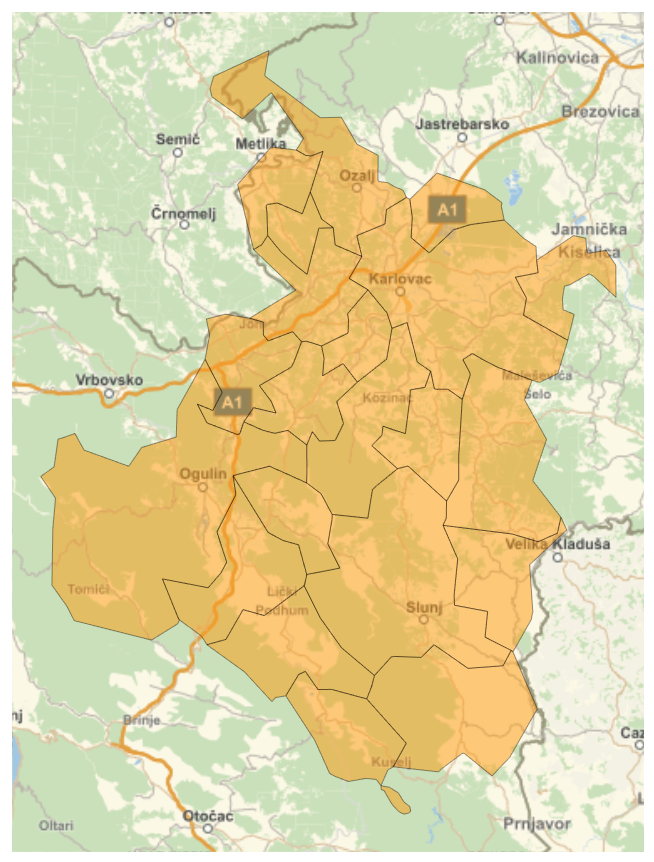
There is immediately a problem visible on the last map, one subdivision is missing. In fact, Wolfram dataset has 9 subdivisions missing and a bunch of non-existent subdivisions included. Three of them are called Unknown_1, Unknown_2, Unknown_3, which doesn’t sound good.
I tried finding a more complete and up do date dataset, but was unsuccessful. I checked data available on:
- https://gadm.org/index.html
- http://www.diva-gis.org/
- http://www.naturalearthdata.com/
- http://geonode.iwlearn.org/layers/geonode:croatia_admin_boundaries#more
All of them have the same incomplete dataset.
So while I’m hunting down the most up to date polygon data for Croatian admin subdivisions, here are some more graphs.
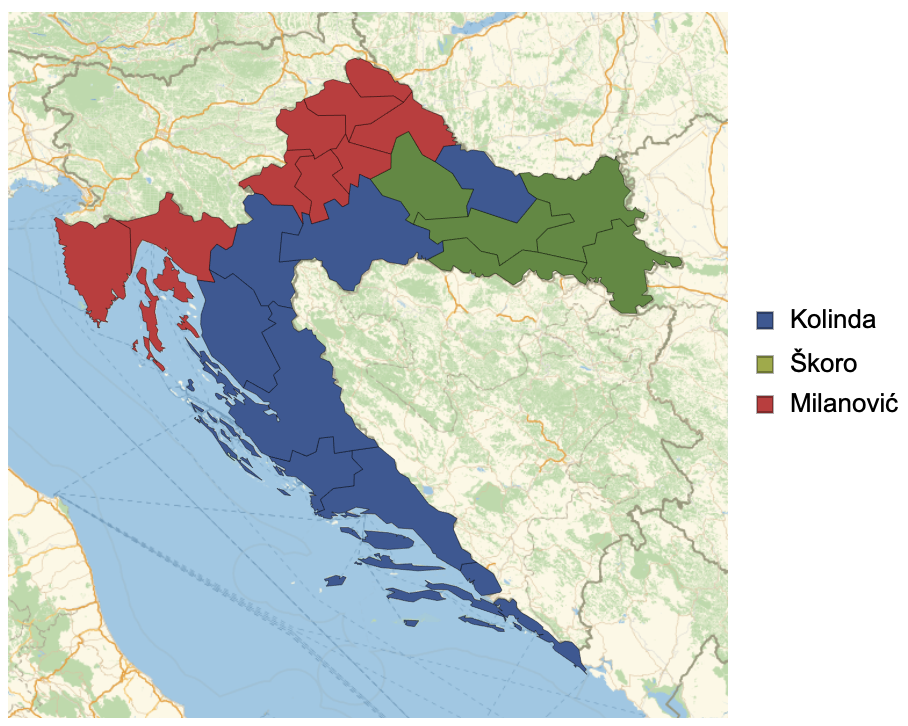
Winner by Subdivision in the First Round of Election
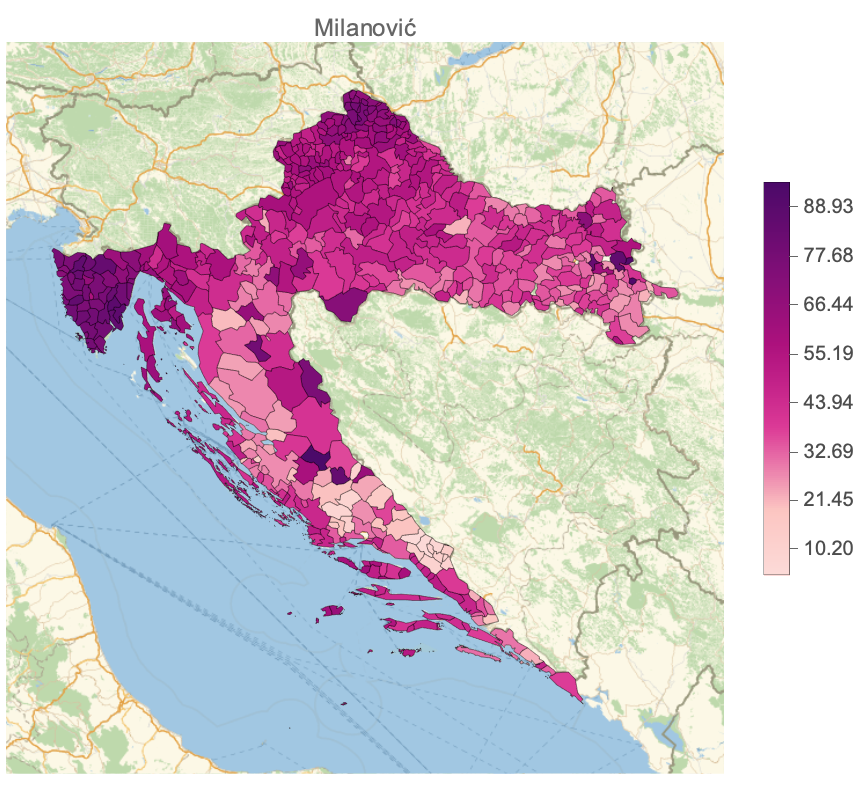
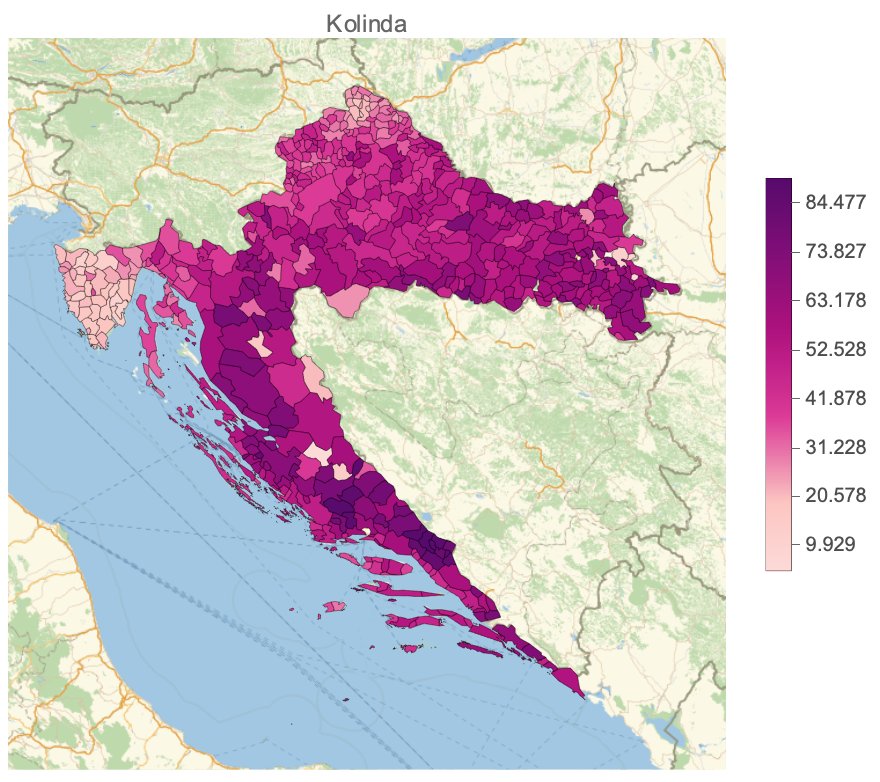
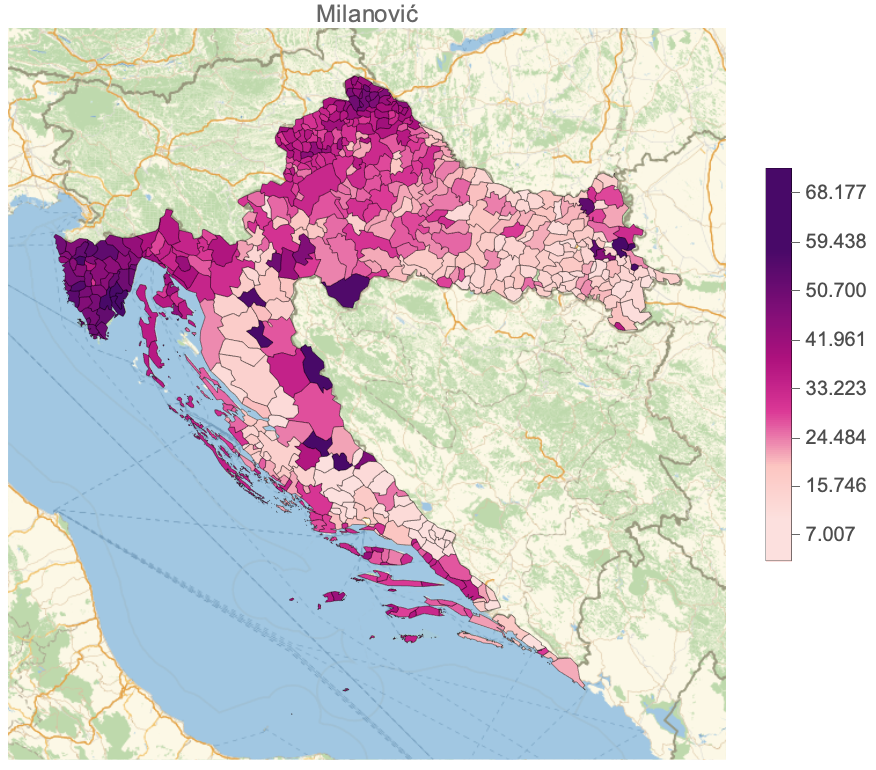
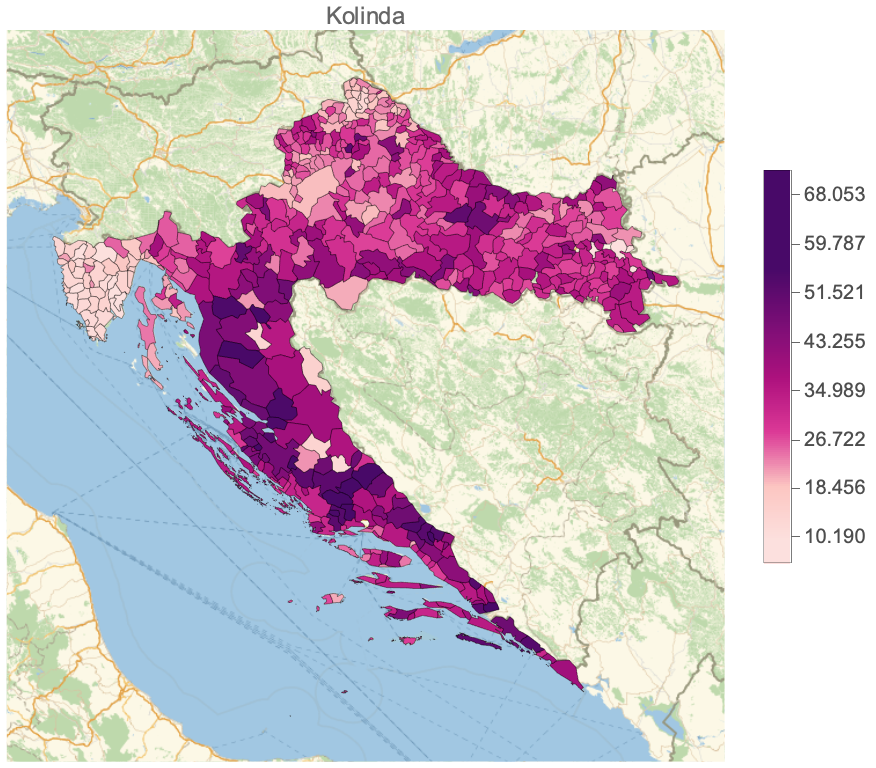
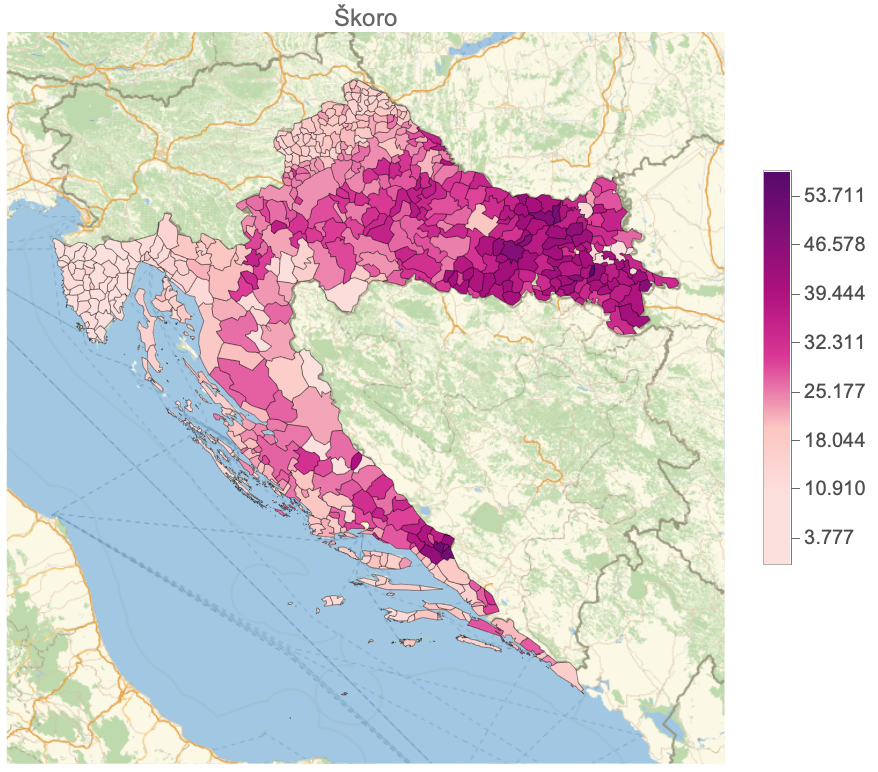
Percentage of Votes for Top 3 Candidates in the First Round of Election
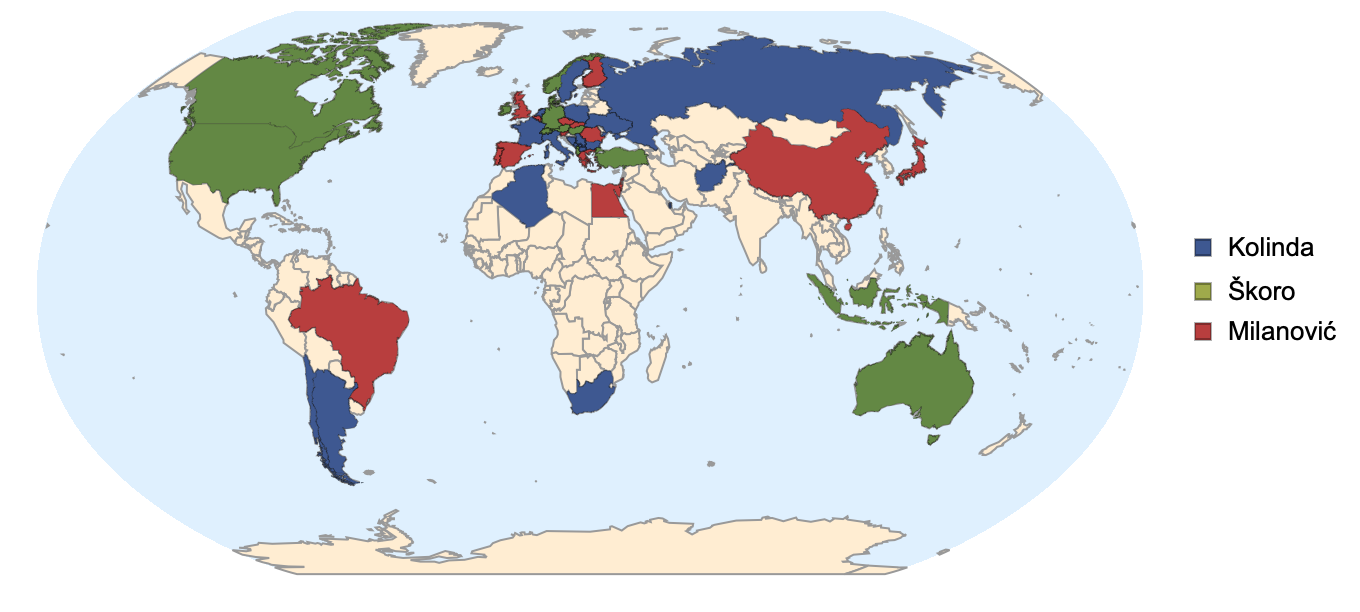
Winner by Country in the First Round of Election